Home > Acoustic design office

ACOUSTIC DESIGN OFFICE
At Red House, an acoustic design firm, we believe that acoustic constraints are levers of creativity
for the spaces we design.
The firm is based in the Paris region and we work throughout France and internationally.
Our services are tailored to all types of projects: recording studios, restaurants, bars, concert halls, offices, festivals, etc.
Need assistance with an acoustic project? Contact us.
POURQUOI FAIRE APPEL À UN BUREAU D’ÉTUDE ACOUSTIQUE ?
Controlling noise pollution and reverberations
The acoustic design office offers a detailed assessment of your sound environment, helping you to improve comfort by reducing noise pollution and reverberation. It is your ally in the acoustic treatment of your premises.
Garantir le respect des normes acoustiques
The noise impact study conducted by the acoustic engineering firm ensures compliance with standards and regulations, particularly with regard to noise in the entertainment, hotel, and restaurant industries.
This allows operators to avoid penalties and disputes related to non-compliance with acoustic standards.
Adapting acoustics to the actual uses of spaces
Our acoustic performance studies are carried out with precision, based on the location being studied, its actual uses, and the relevant acoustic requirements.
Thanks to our measuring tools and the expertise of our acoustic engineers, we offer tailor-made solutions.
POURQUOI CHOISIR RED HOUSE COMME BUREAU D’ÉTUDE ACOUSTIQUE ?
Une expertise acoustique reconnue
For more than 15 years, Red House's achievements have demonstrated its unparalleled expertise.
Leading musicians and prestigious venues have entrusted us with the acoustic treatment and design of their studios, concert halls, restaurants, and more.
A comprehensive approach, from study to implementation
For each project, our role does not end with acoustic studies or interior design; we advise you right up to delivery and ensure quality control for each of our projects.
Une expertise adaptée à des lieux aux usages variés
Red House's expertise is suited to a wide variety of venues. Every project begins with a specific study of requirements based on the type of venue, acoustic standards, and expected sound comfort.
Red House works with venues for a variety of uses:
recording studios
home theaters
restaurants
offices
concert hall
bars, clubs

Demanding support, beyond a simple report
At Red House, we are committed to supporting a project from its initial design to its final delivery. We work hand in hand with you to design the project of your dreams, and our work does not stop with the delivery of a report!
RED HOUSE'S APPROACH AS AN ACOUSTIC DESIGN FIRM
A clear and structured methodology
Red House implements a structured methodology that ranges from needs analysis to results verification.
Project data collection
Define objectives and performance criteria
Measurements and/or numerical modeling
Proposal of suitable technical solutions
Implementation of the project
Post-work inspection of results
Concrete and actionable recommendations
Red House is committed to making very specific recommendations following an acoustic study. Depending on the location and its use, we recommend solutions focused on layout, technical equipment, and best practices to ensure lasting acoustic comfort.
Support tailored to your needs
Red House can help with a variety of needs, whether it's bringing your property up to current standards or installing soundproofing, for example. Tell us about your project and we'll tailor our services to your requirements.
BUREAU D’ÉTUDE ACOUSTIQUE À PARIS ET EN FRANCE : NOS ZONES D’INTERVENTION
Red House is an acoustic engineering firm based in Paris, but we work throughout France depending on the needs and complexity of the projects. We have worked on numerous projects in the Île-de-France region, as well as in Toulouse, Marseille, Bordeaux, and elsewhere.
SEPARATE ACOUSTIC STUDIES FOR EACH PROJECT

EXEMPLES DE PROJETS ET RÉFÉRENCES EN ACOUSTIQUE
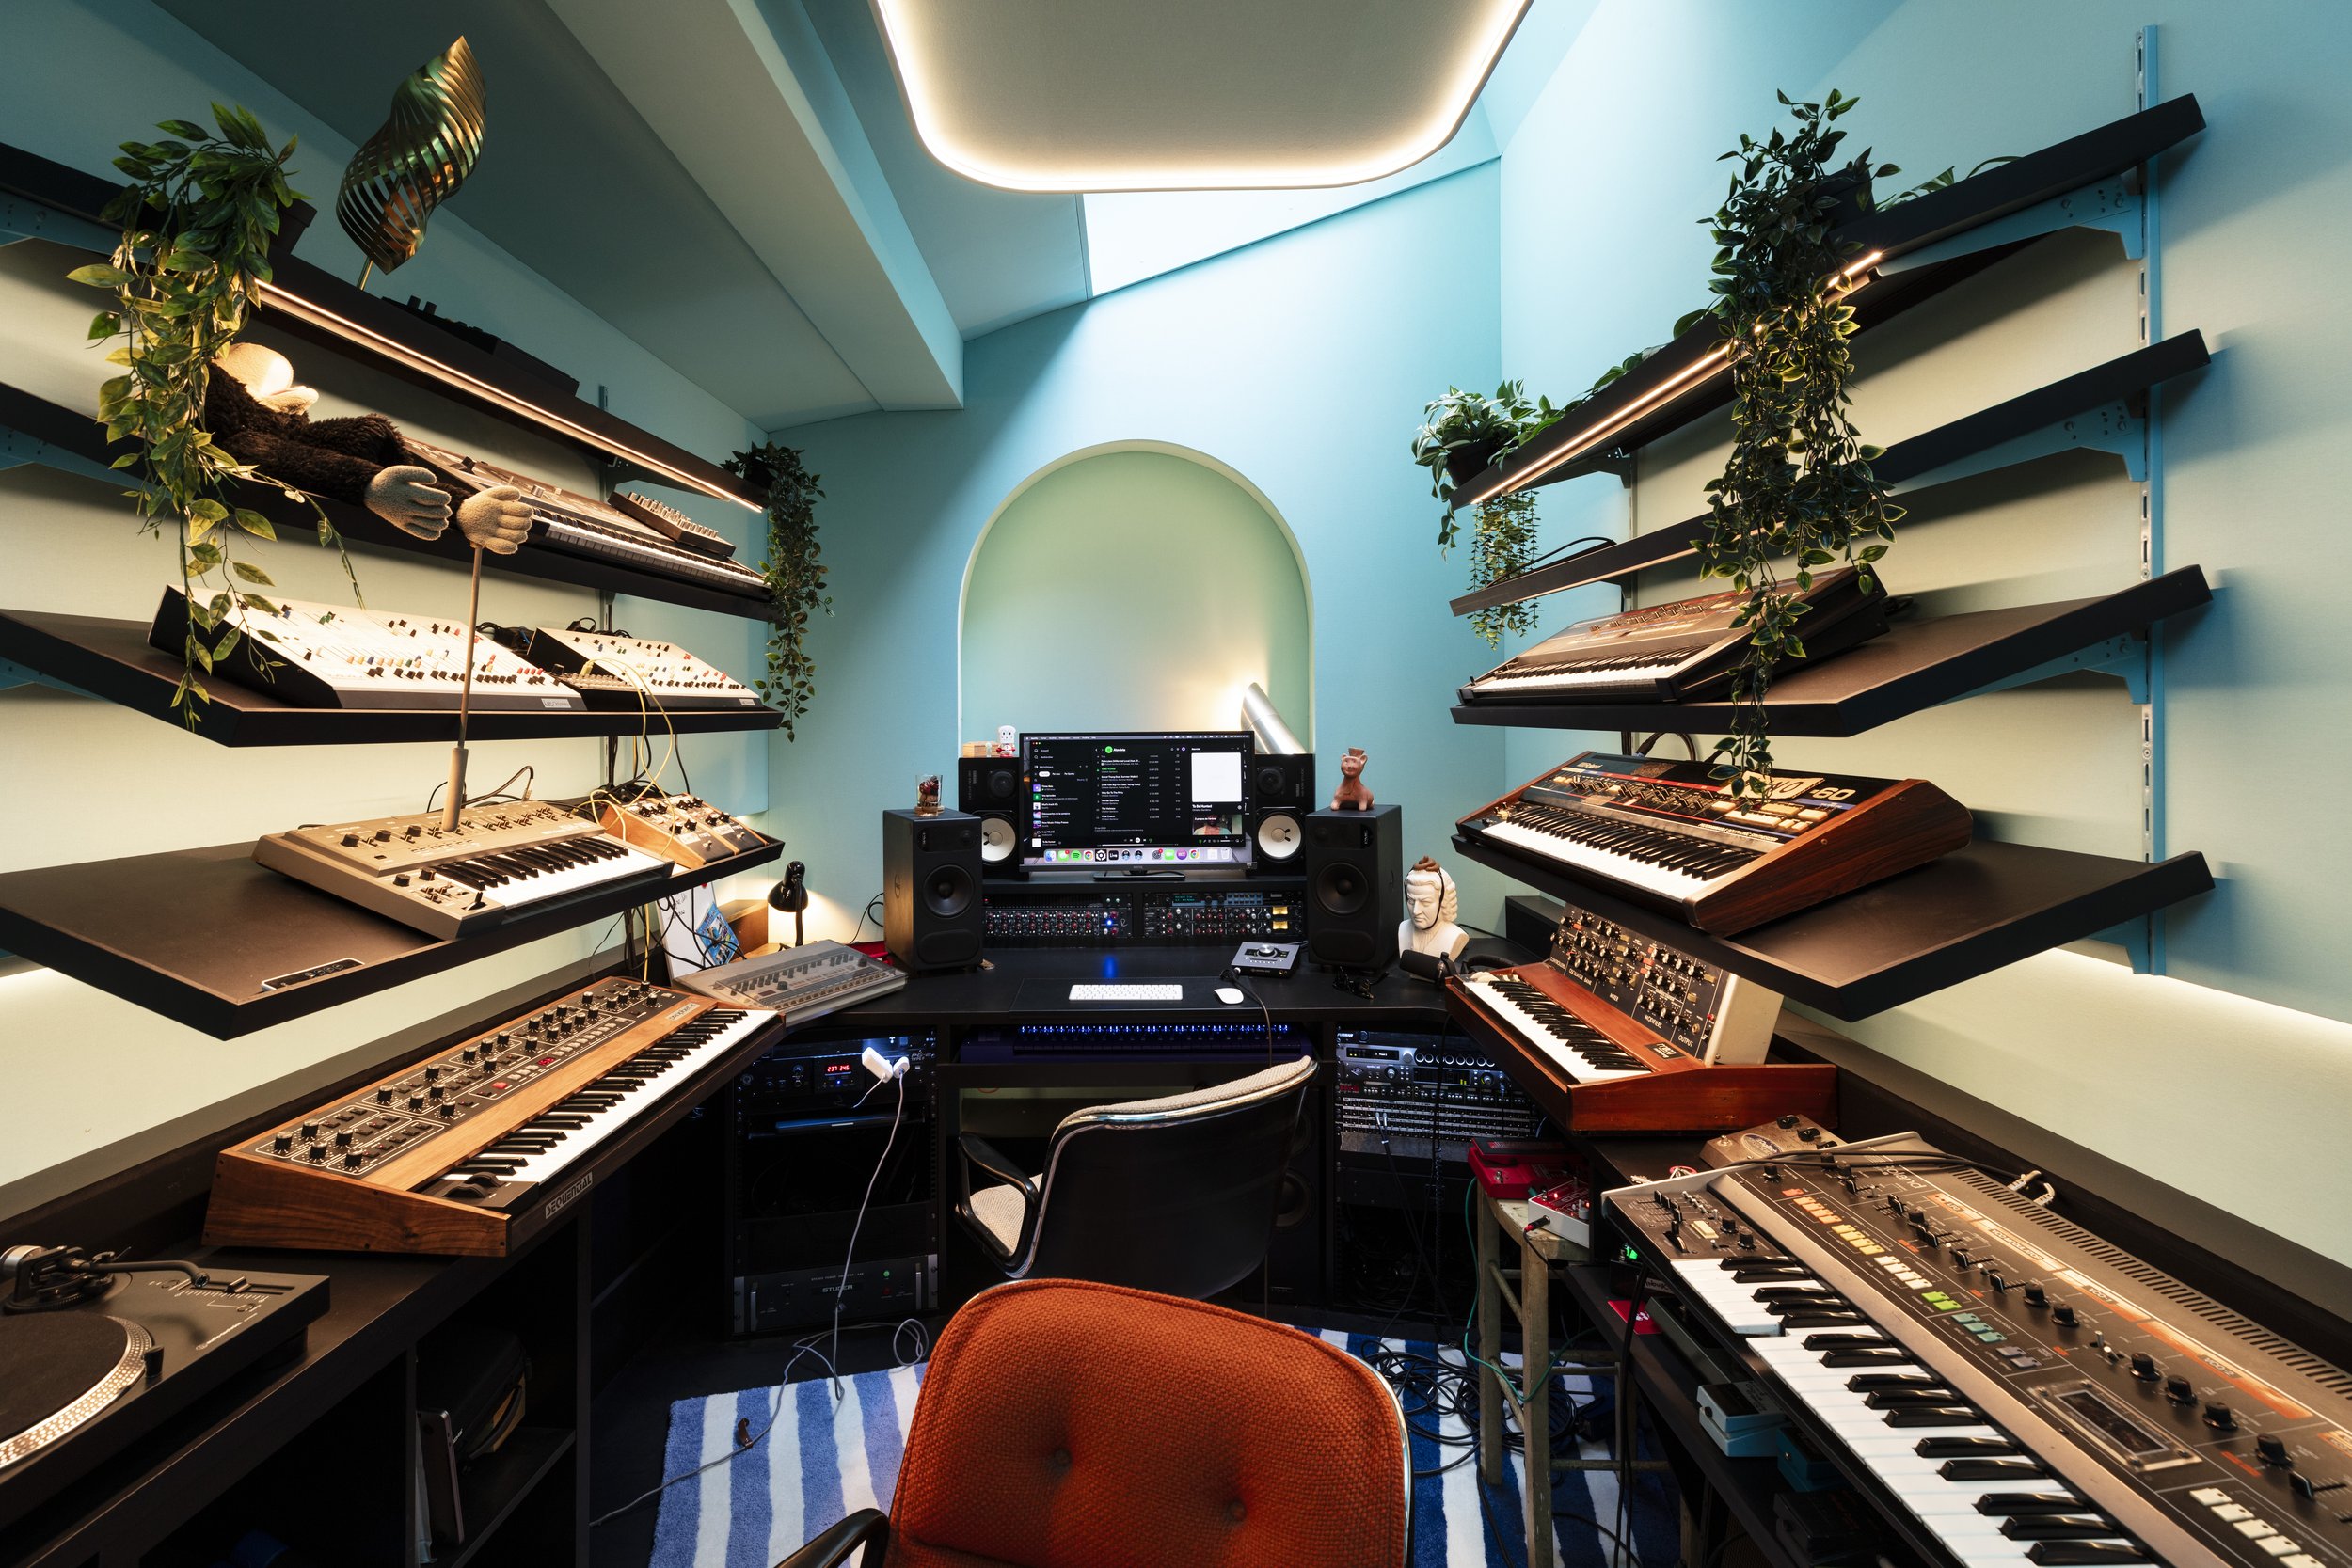
Studio de musique avec synthétiseurs, ordinateurs, enceintes, plantes et sièges, murs peints en bleu clair avec plafond lumineux.

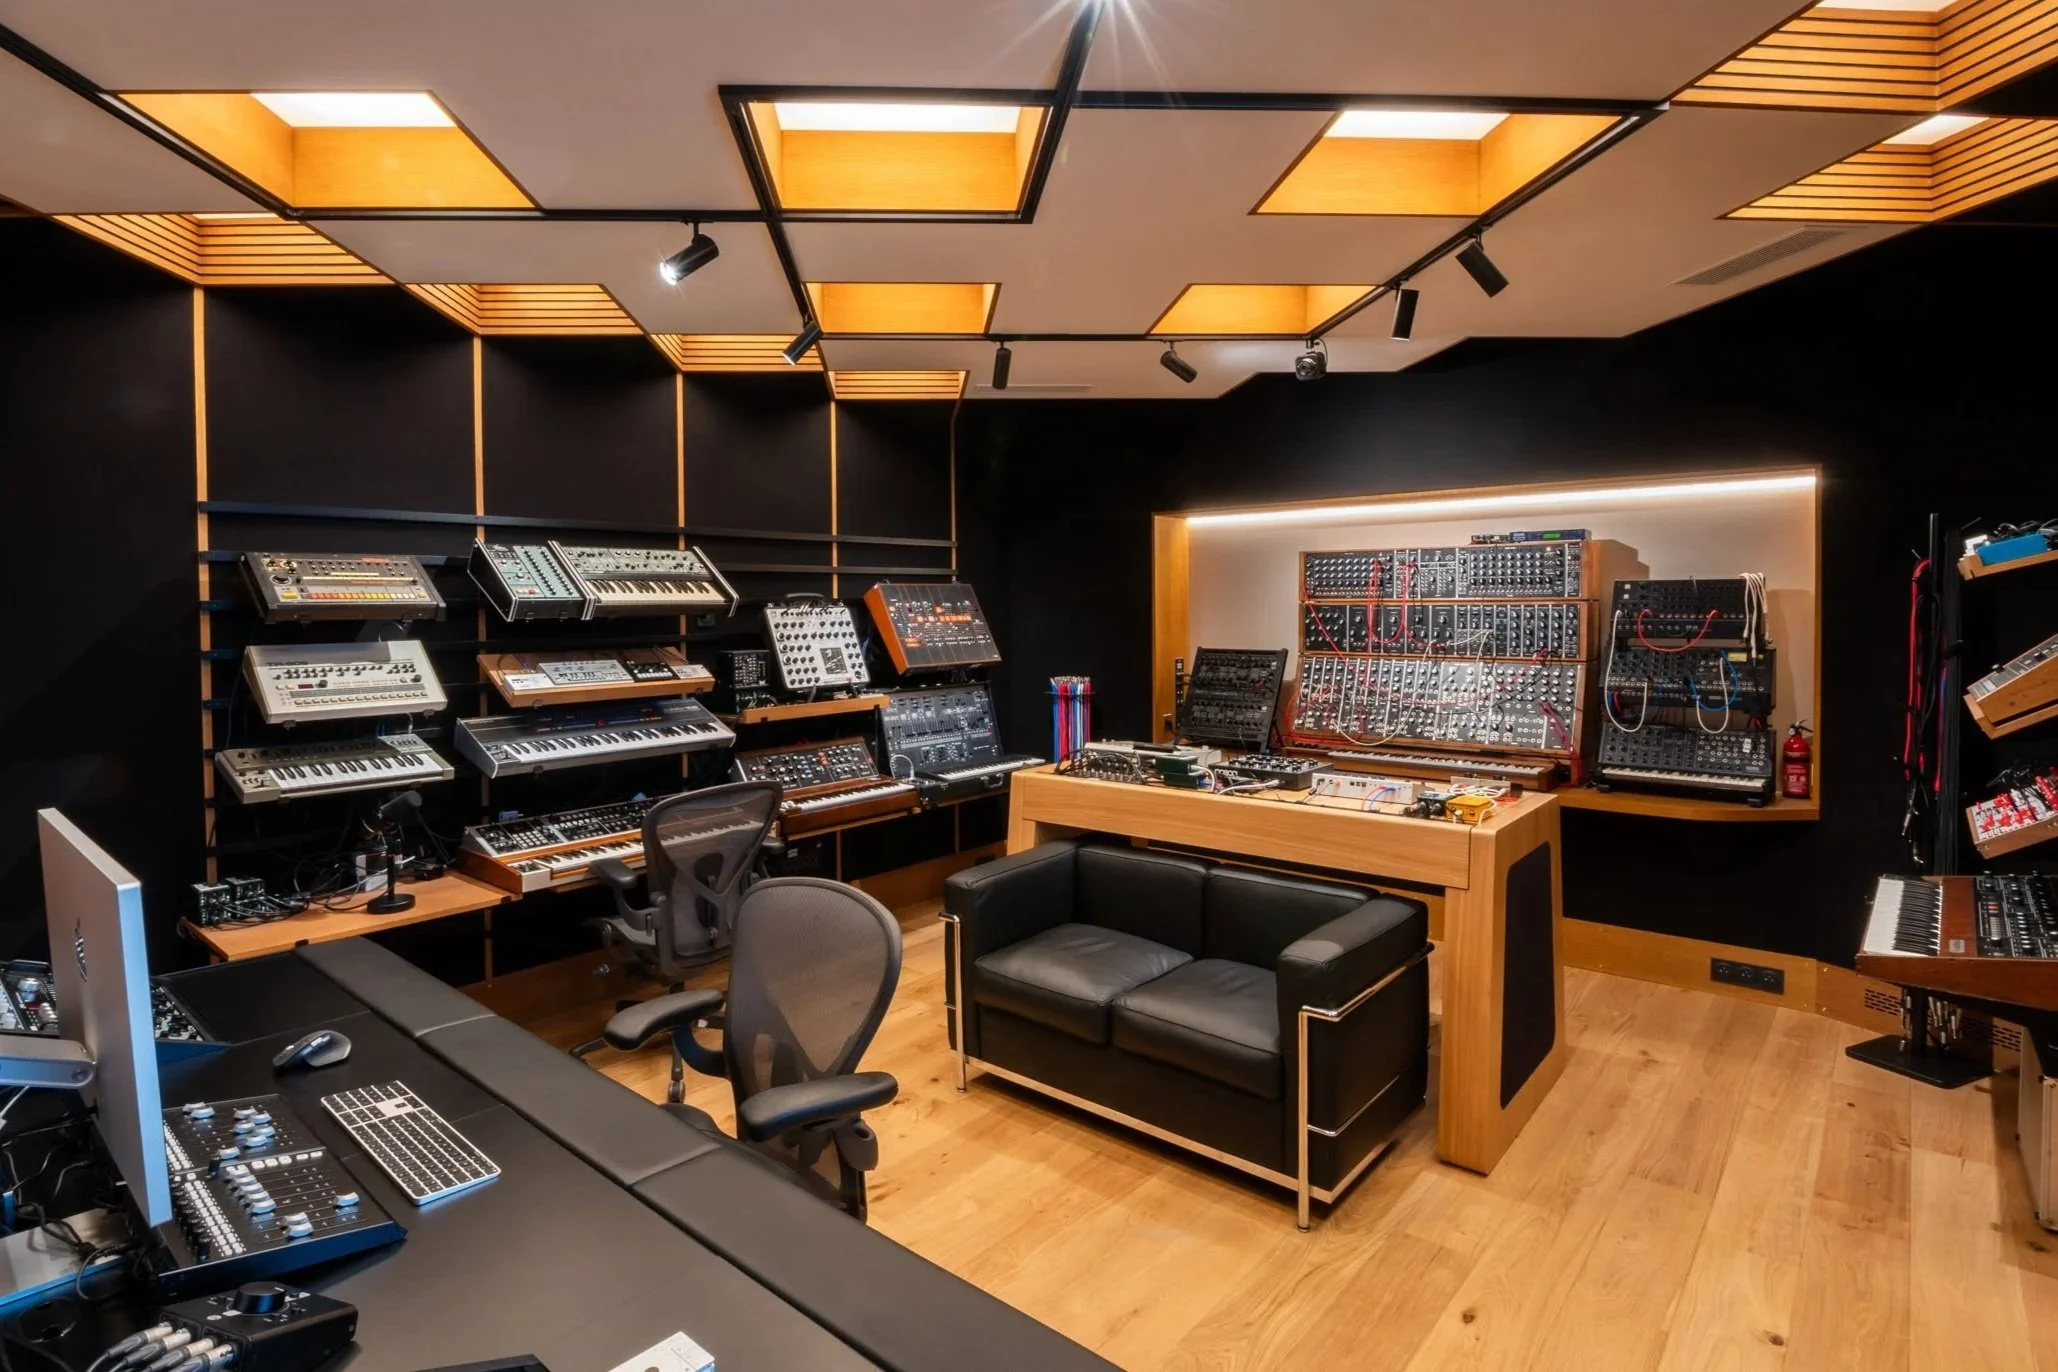
Magasin d'électronique avec une variété d'enceintes audio sur des étagères en bois et verre, intérieur sombre et élégant.

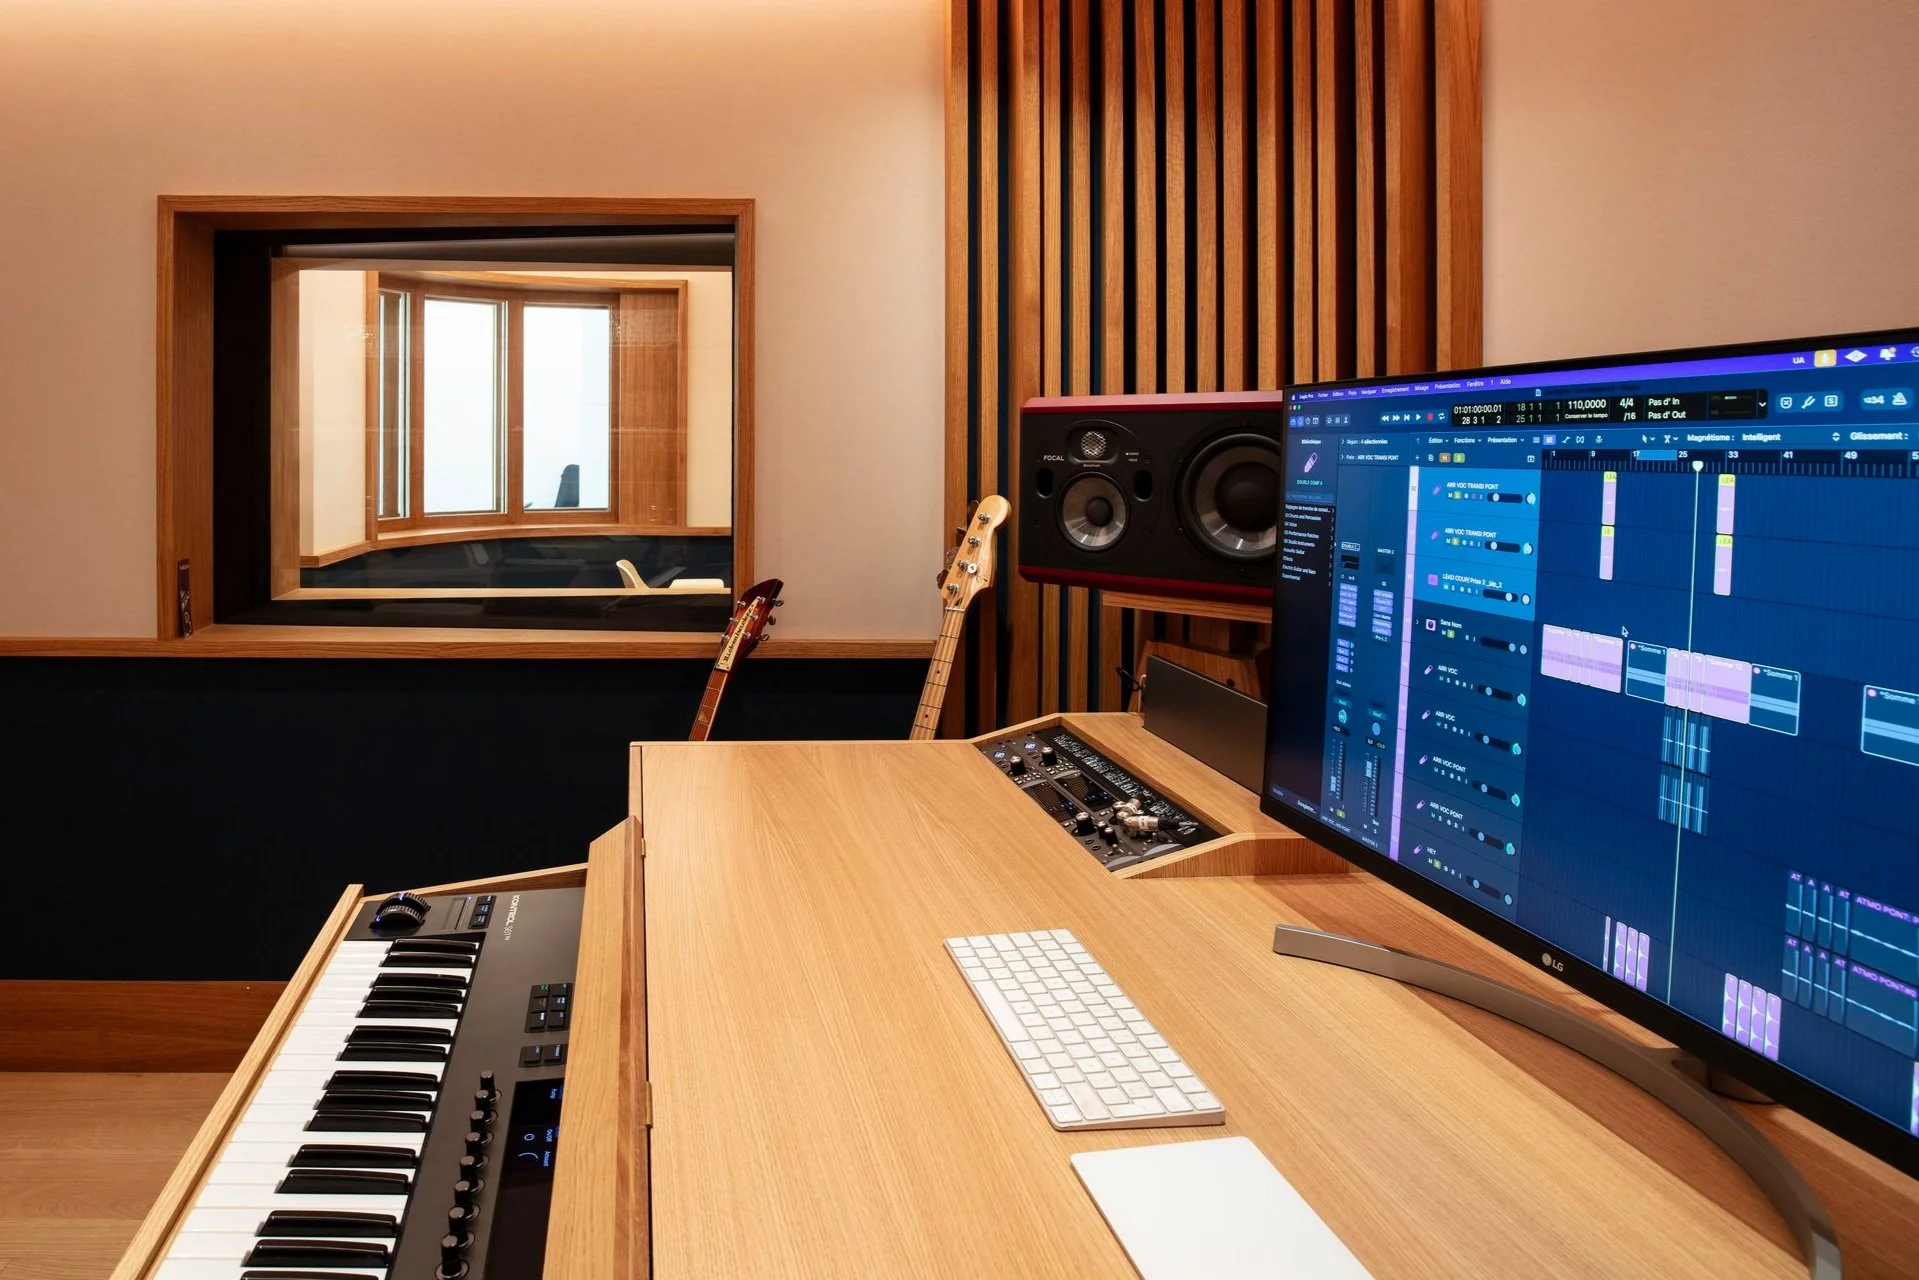
Studio d'enregistrement avec plusieurs instruments de musique et équipements audio, y compris claviers, haut-parleurs, moniteurs, et un ordinateur, dans une pièce bien éclairée avec fenêtres.

Cabine photo photomaton orange à l'intérieur avec des lumières orange, située dans un hall avec des grandes fenêtres montrant des arbres et des bâtiments par temps nuageux.
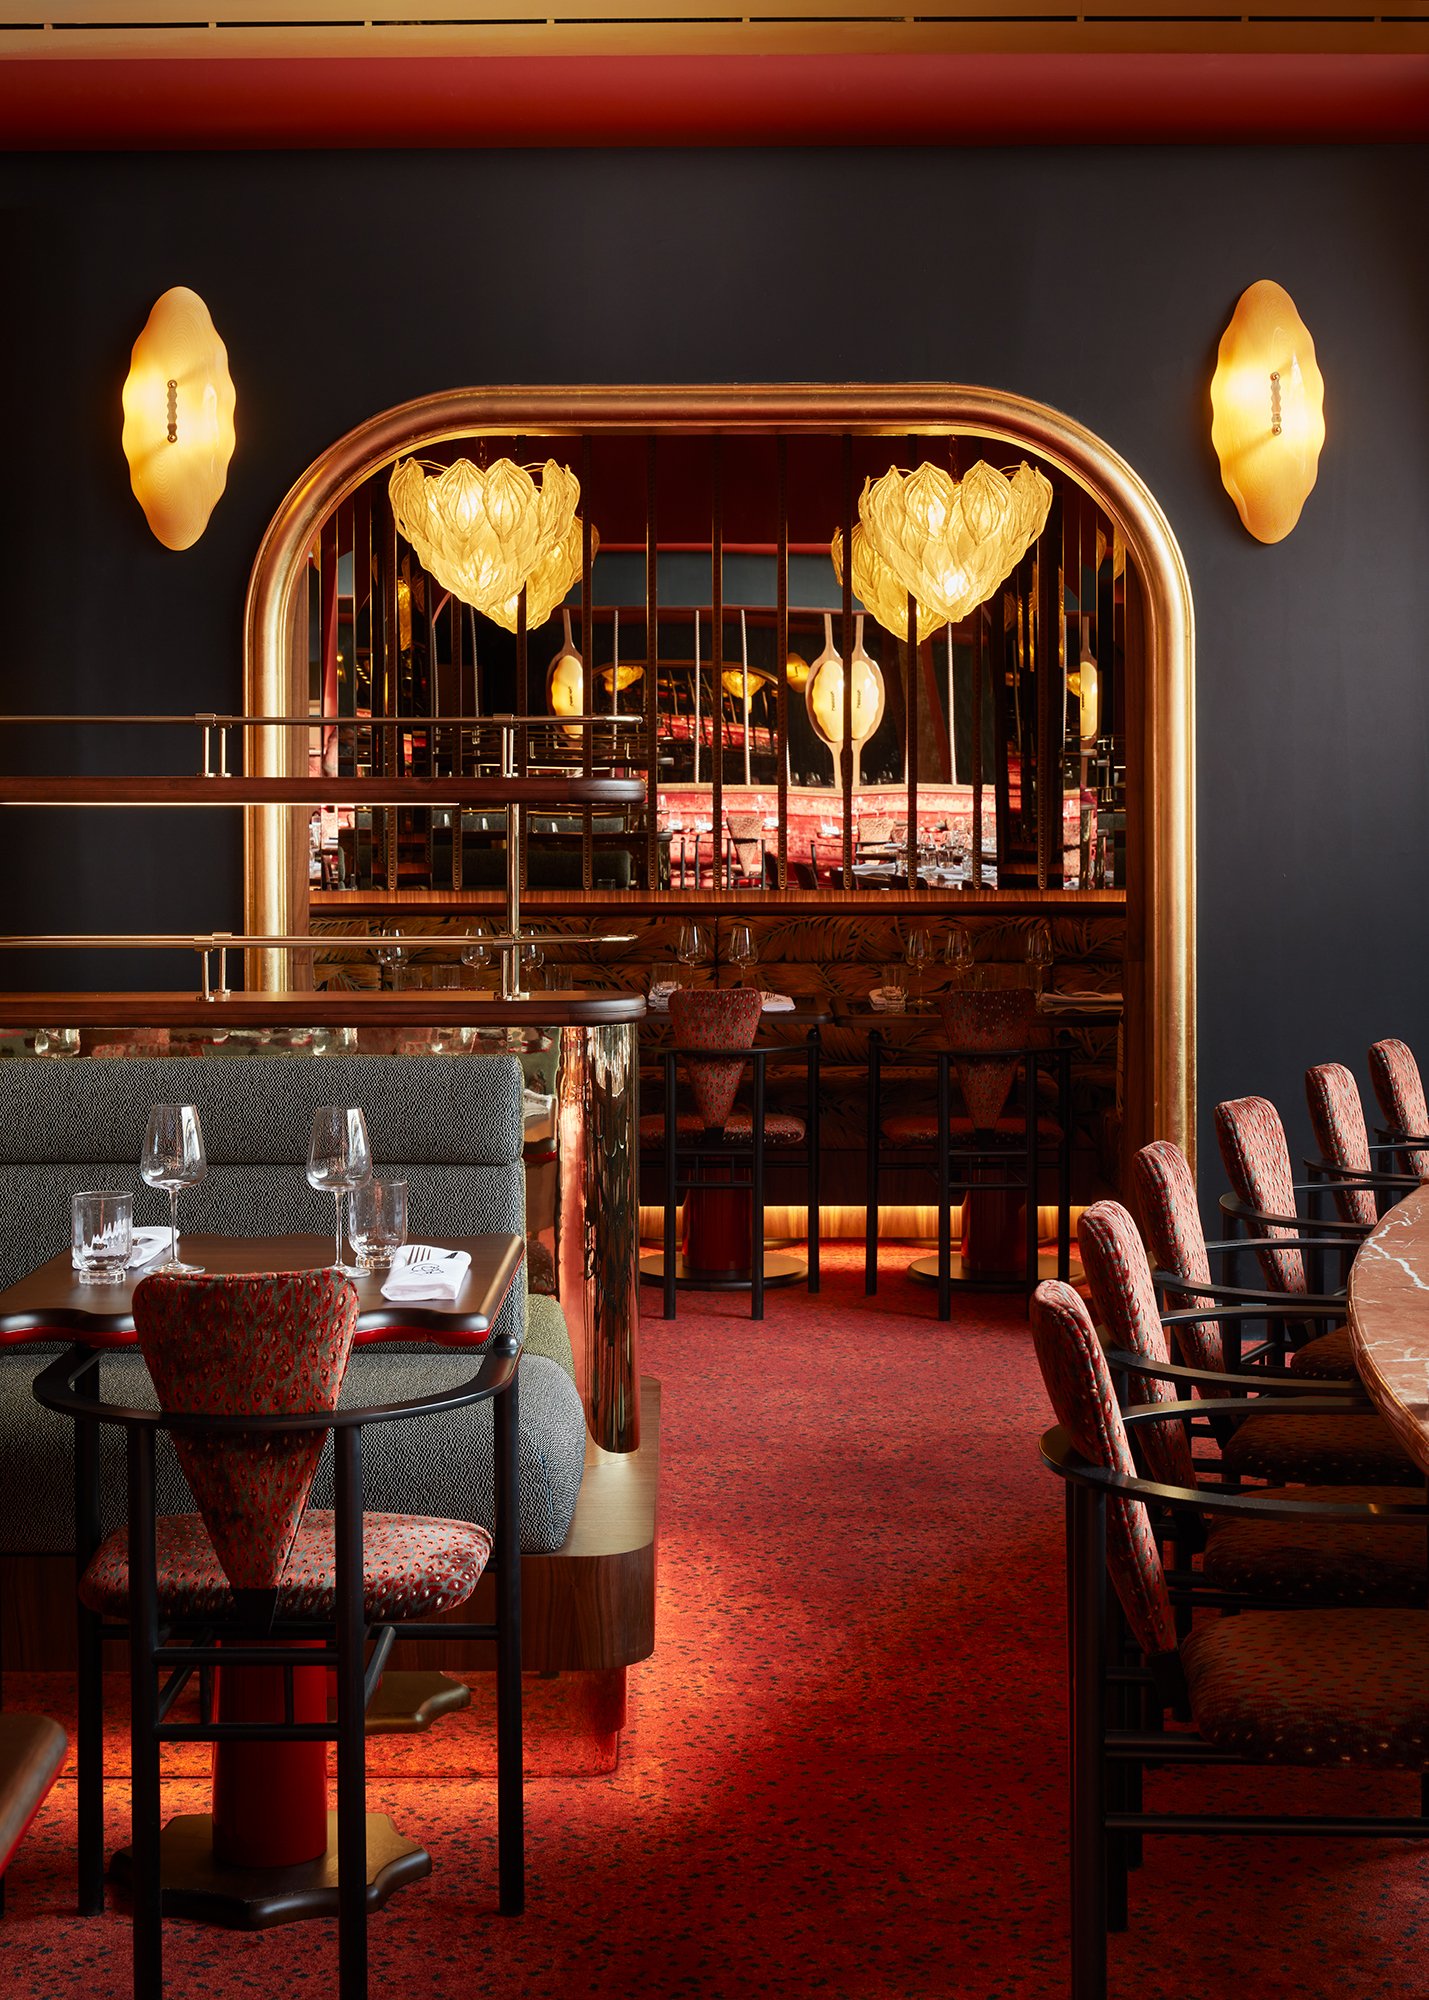
Intérieur d'un restaurant élégant avec mobilier en bois et en tissus aux motifs rouges et gris, murs noirs, lumières d'ambiance en forme de coeurs en papier et appliques murales

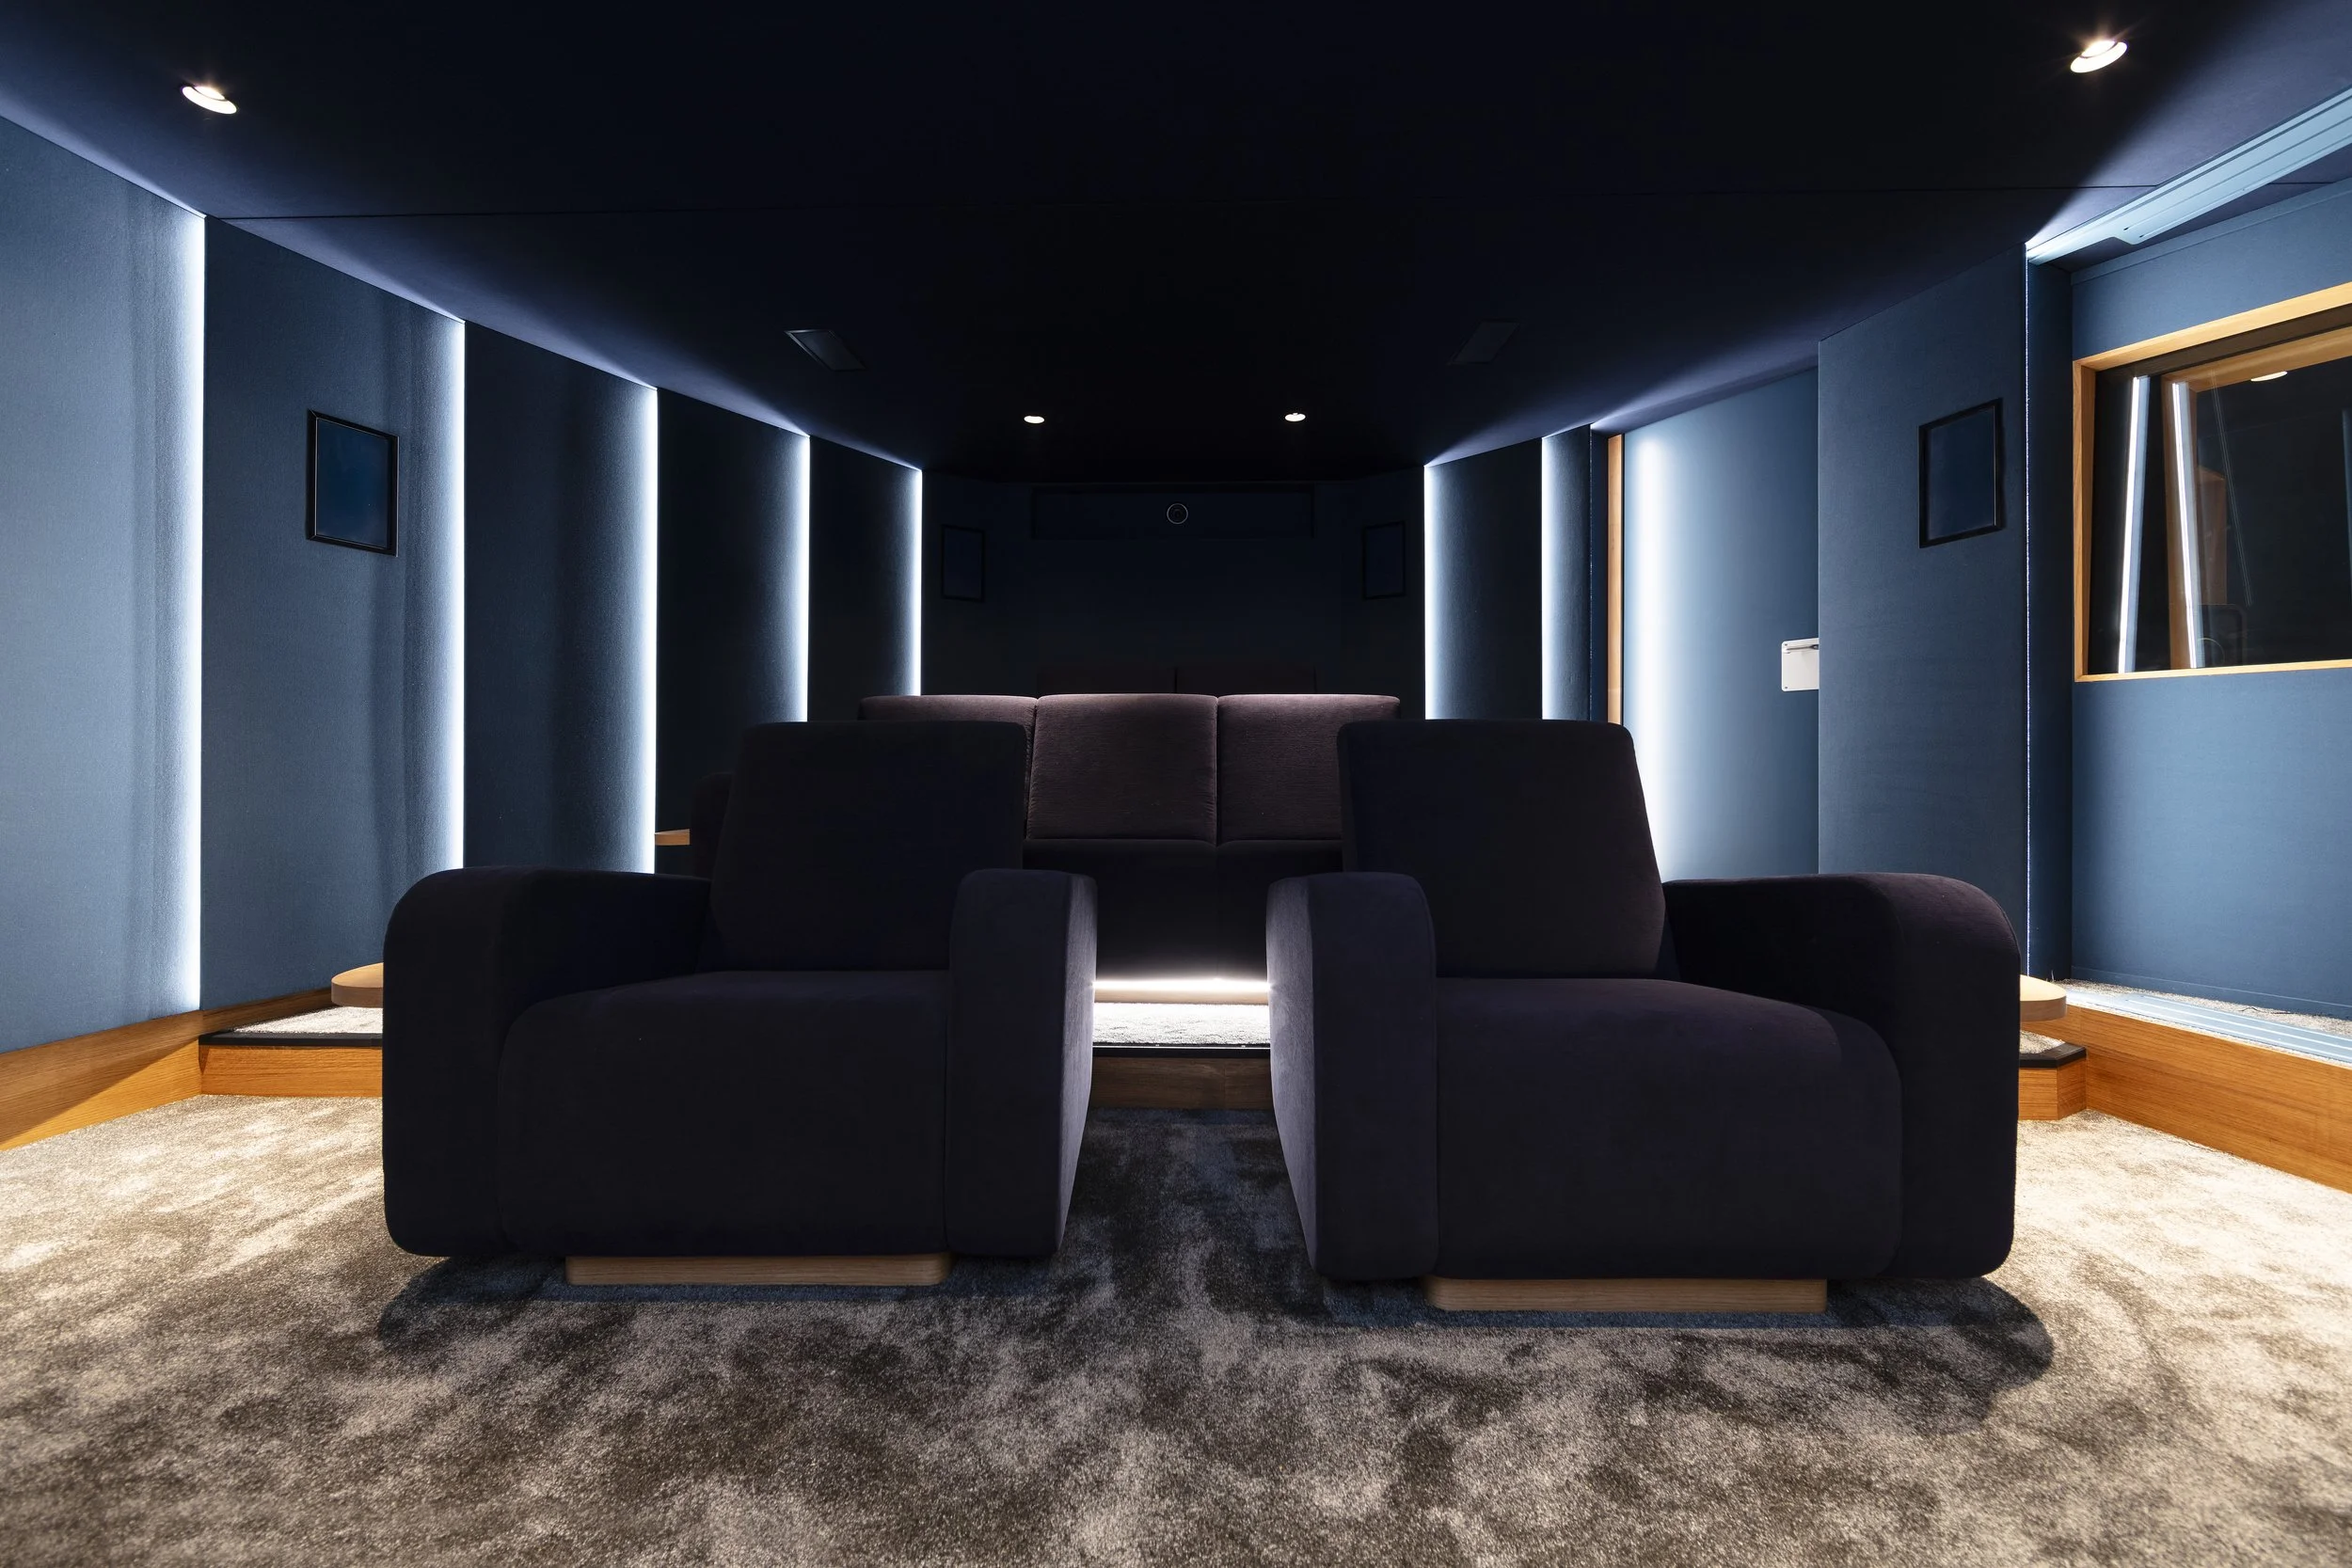
Une salle de cinéma luxueuse avec des sièges en bois et en velours, un écran géant affichant un iguane, et un éclairage tamisé avec des lumières d'ambiance sur les murs.

Une vue en perspective d'un espace de bureau divisé en plusieurs petites cabines en bois clair, avec des plantes vertes en premier plan et un plafond courbé avec des ventilateurs modernes.
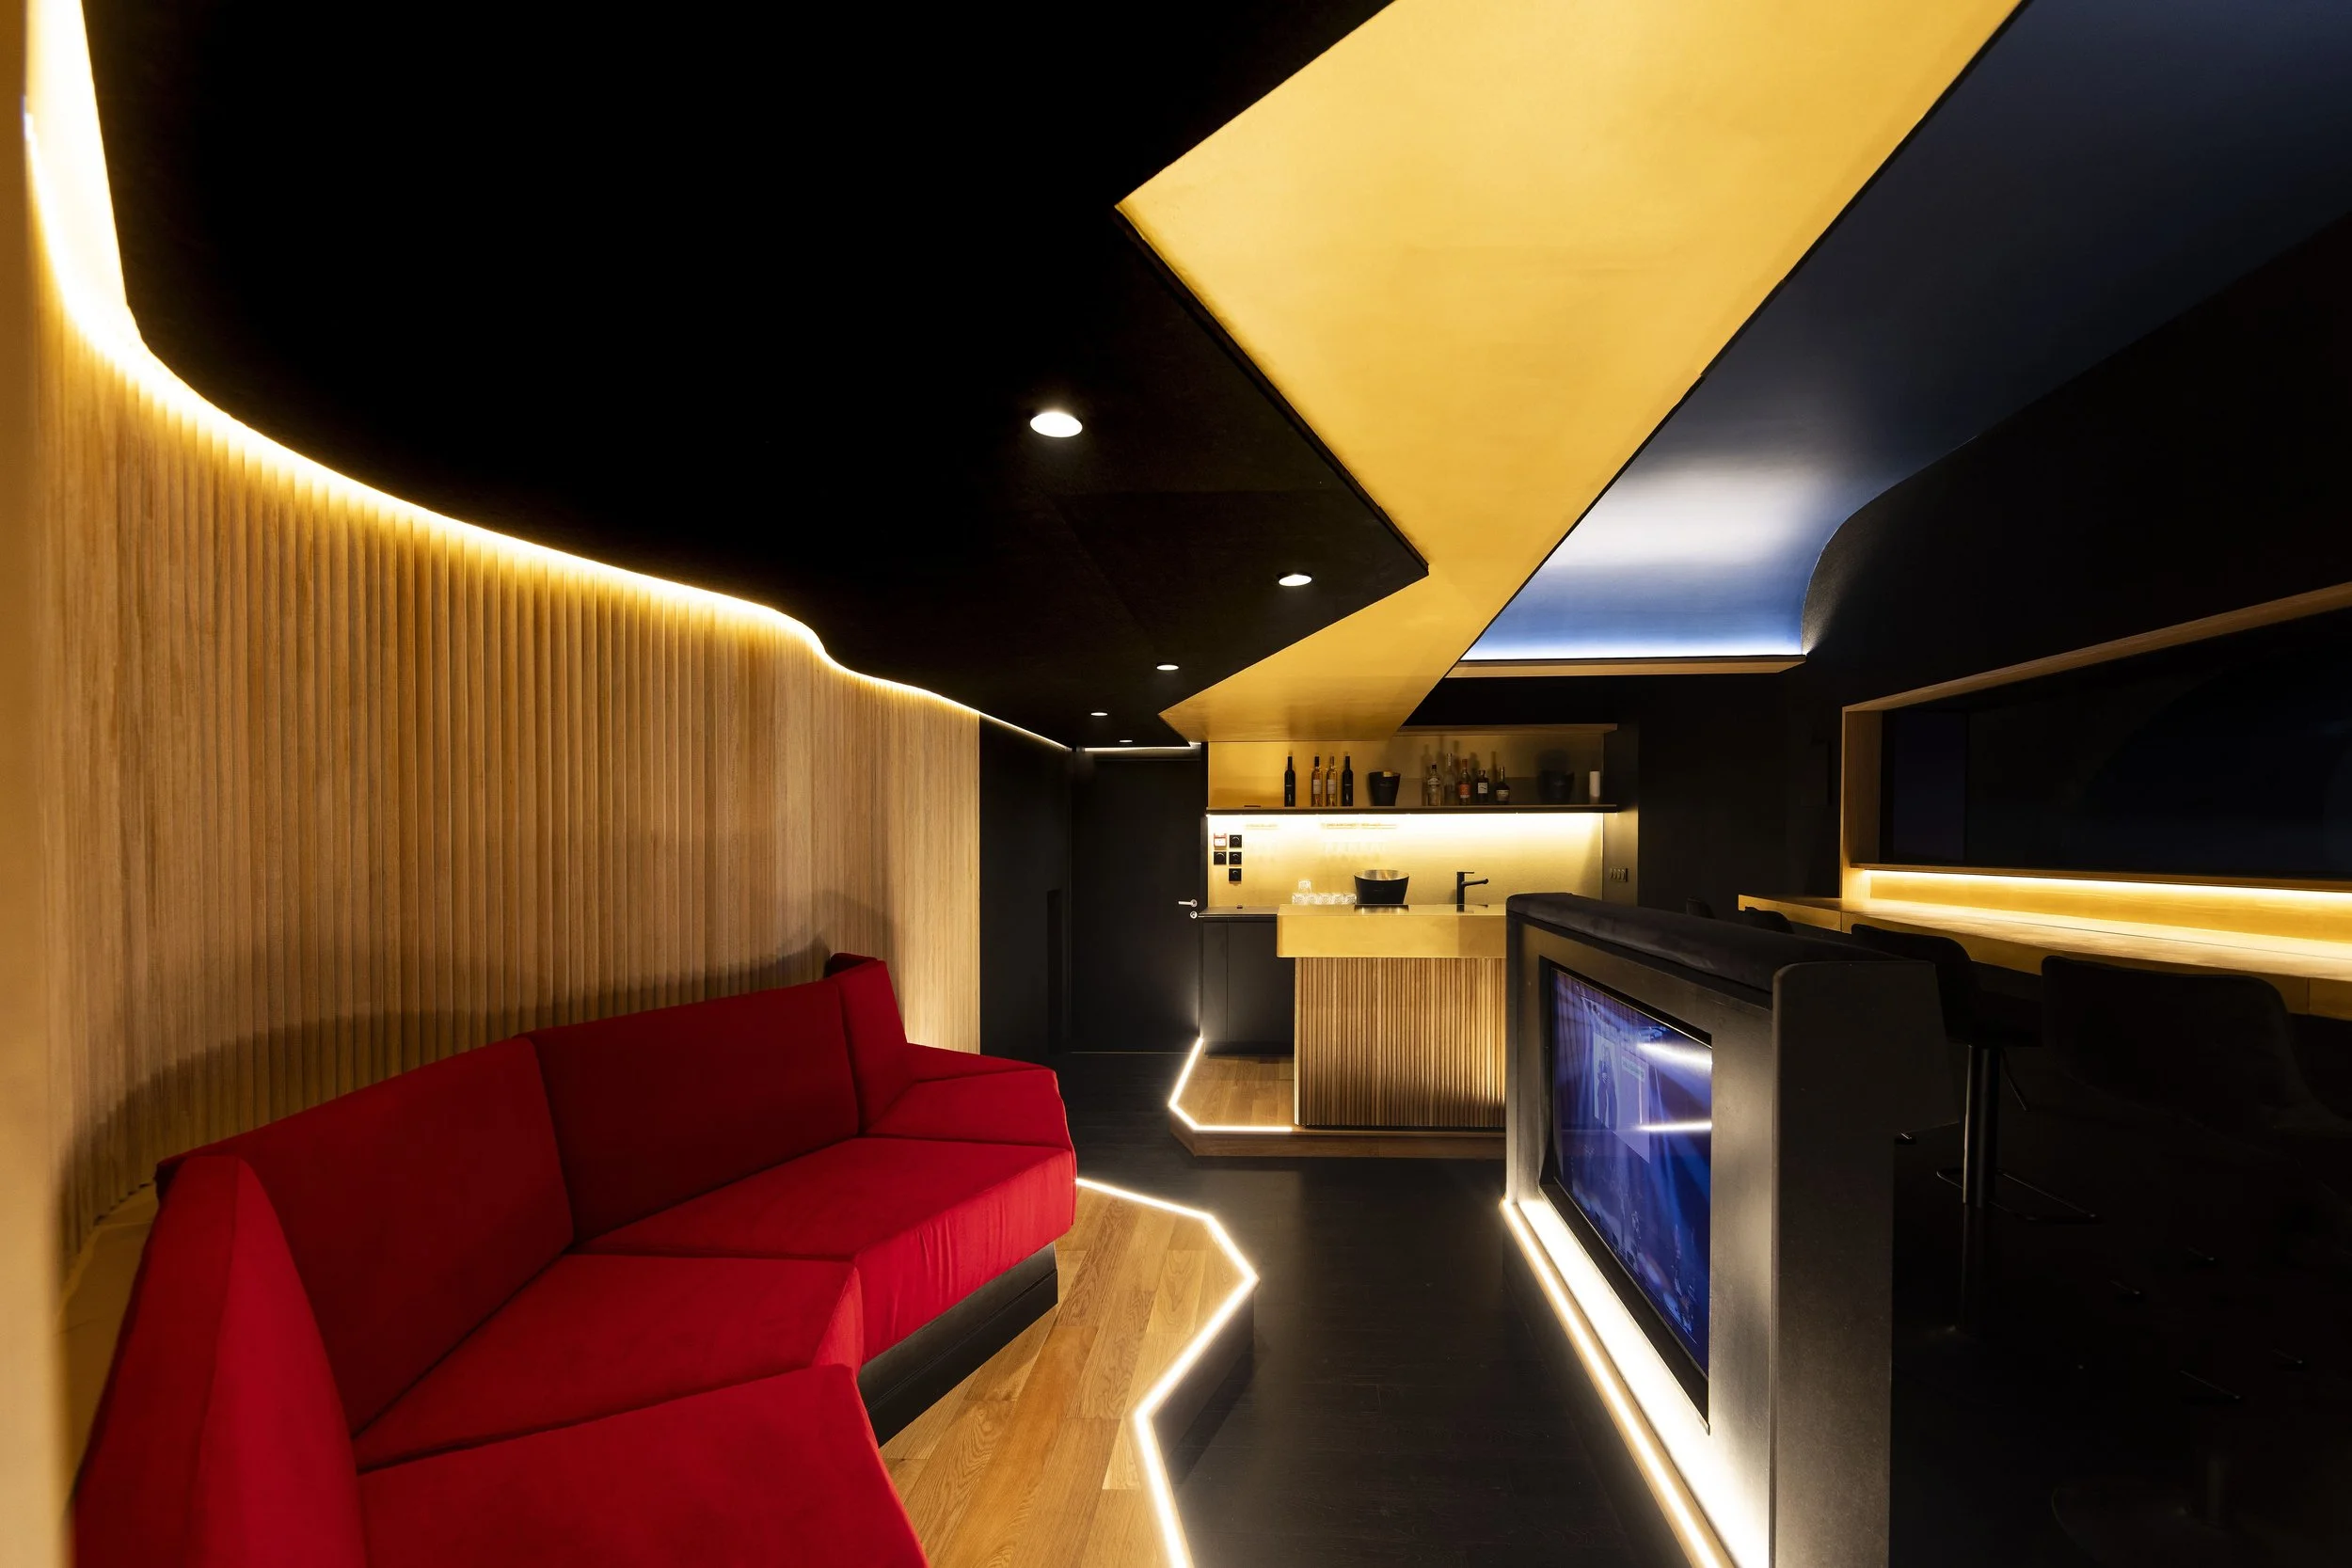
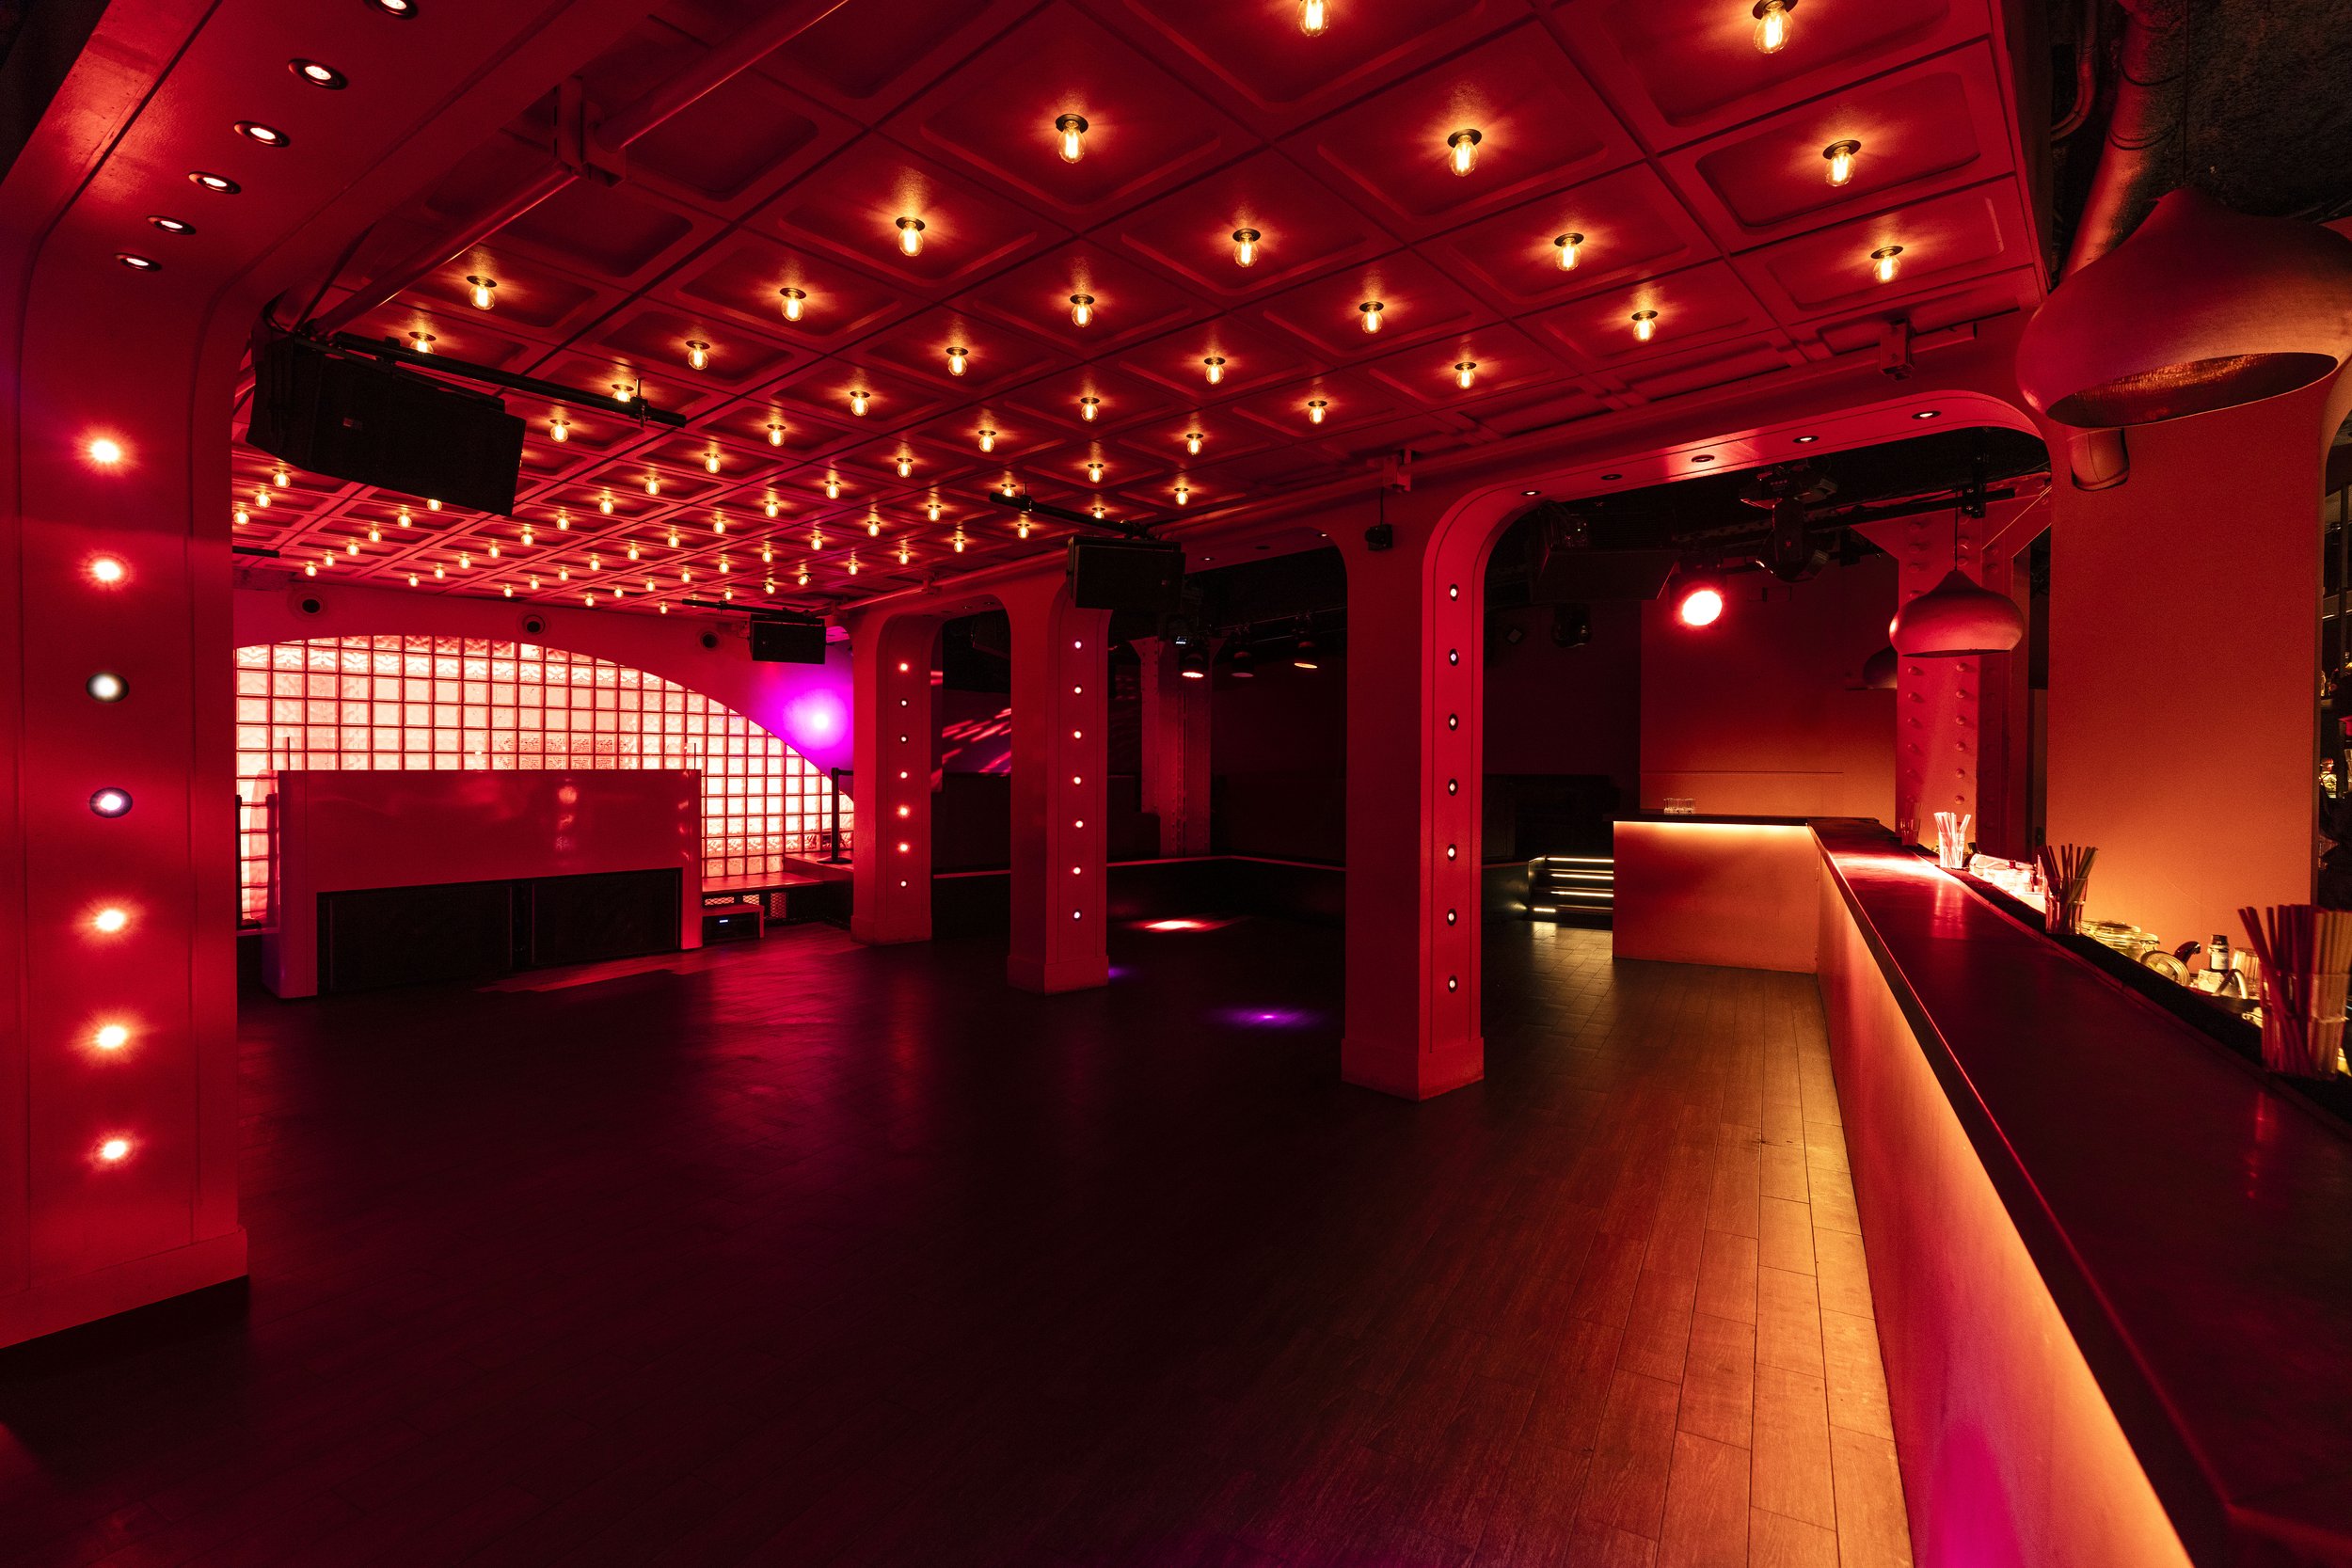
Salon moderne avec canapé rouge, mur en bois clair, plafond noir avec éclairage LED jaune, bar avec bouteilles et un grand écran
SEE ALL OUR PROJECTS
ACOUSTIC DESIGN OFFICE: FREQUENTLY ASKED QUESTIONS
-
An acoustic engineering firm is responsible for analyzing, predicting, and controlling noise and acoustics in a location or facility, then proposing technical solutions to ensure acoustic comfort and compliance with regulations.
-
An acoustic engineering firm is called in whenever a project is likely to cause noise pollution or comfort issues, or when regulations require justification of the acoustic performance of the site.
-
An acoustic engineering firm is the organization that conducts studies, while a noise impact study is a specific task carried out by the firm.
-
Acoustic engineering firms do not only intervene in cases of noise pollution. They can also intervene upstream to anticipate such pollution and ensure optimal acoustic comfort in a planned location.
-
Prices may vary depending on the project. At Redhouse
For reference:
→ Simple EINS mission with one transmission point and two reception points: €2,000 excluding tax→ Acoustic study and design of recording studios: This service is generally charged as a fee of between 12% and 18% of the cost of the work. Depending on the type of project, a preliminary study phase is offered starting at €1,500 excluding tax, including acoustic measurements, a measurement report, a project outline, and a preliminary estimate of the cost of the work.
→ Acoustic study and design for home studios: Flat-rate service available from
starting at €1,500 excluding tax.Further details available on request
-
Red House is here to support acoustic projects from analysis to implementation of tailored solutions.
-
Ideally, an acoustic engineering firm should be consulted early on in the project so that the proposed solutions can be integrated into the project's implementation.
DISCOVER OUR OTHER SERVICES